| Updated: October 11, 2016 4:59 PM | National referendum |
Status of data processing: 100,00 % |
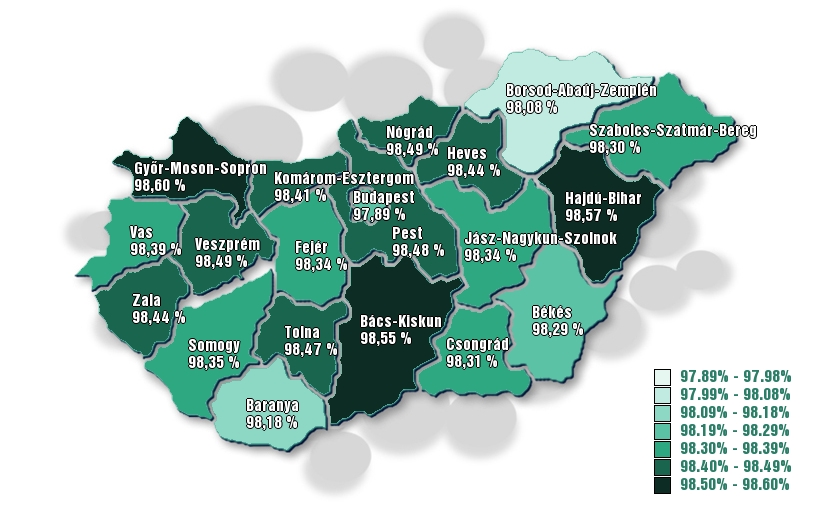
Indicative data regarding the votes cast in the national referendum
Territorial percentage of the NO votes attaining majority on country level:
Synthesis of territorial data
| County | Number of those eligible to vote |
Turned out to vote | Valid votes | Yes | No | ||||
|---|---|---|---|---|---|---|---|---|---|
| number | percentage (%) |
number | percentage (%)* |
number | percentage (%)** |
number | percentage (%)** |
||
| Total votes cast in Hungary | 7 986 767 | 3 506 618 | 43,91 | 3 280 459 | 41,07 | 54 924 | 1,67 | 3 225 535 | 98,33 |
| BUDAPEST | 1 344 596 | 530 143 | 39.43 | 467 066 | 34.74 | 9 868 | 2.11 | 457 198 | 97.89 |
| BARANYA | 311 384 | 126 861 | 40.74 | 119 486 | 38.37 | 2 177 | 1.82 | 117 309 | 98.18 |
| BÁCS-KISKUN | 425 781 | 195 665 | 45.95 | 186 386 | 43.78 | 2 708 | 1.45 | 183 678 | 98.55 |
| BÉKÉS | 292 927 | 126 408 | 43.15 | 119 697 | 40.86 | 2 045 | 1.71 | 117 652 | 98.29 |
| BORSOD-ABAÚJ-ZEMPLÉN | 541 606 | 225 923 | 41.71 | 214 056 | 39.52 | 4 100 | 1.92 | 209 956 | 98.08 |
| CSONGRÁD | 337 051 | 150 659 | 44.7 | 139 596 | 41.42 | 2 366 | 1.69 | 137 230 | 98.31 |
| FEJÉR | 345 376 | 155 574 | 45.04 | 146 407 | 42.39 | 2 424 | 1.66 | 143 983 | 98.34 |
| GYŐR-MOSON-SOPRON | 360 278 | 184 149 | 51.11 | 174 991 | 48.57 | 2 456 | 1.4 | 172 535 | 98.6 |
| HAJDÚ-BIHAR | 434 116 | 187 334 | 43.15 | 178 502 | 41.12 | 2 551 | 1.43 | 175 951 | 98.57 |
| HEVES | 246 297 | 113 388 | 46.04 | 107 379 | 43.6 | 1 675 | 1.56 | 105 704 | 98.44 |
| JÁSZ-NAGYKUN-SZOLNOK | 311 024 | 132 347 | 42.55 | 125 482 | 40.34 | 2 079 | 1.66 | 123 403 | 98.34 |
| KOMÁROM-ESZTERGOM | 248 993 | 108 897 | 43.73 | 102 585 | 41.2 | 1 632 | 1.59 | 100 953 | 98.41 |
| NÓGRÁD | 161 519 | 72 818 | 45.08 | 69 372 | 42.95 | 1 050 | 1.51 | 68 322 | 98.49 |
| PEST | 995 492 | 434 086 | 43.61 | 404 810 | 40.66 | 6 151 | 1.52 | 398 659 | 98.48 |
| SOMOGY | 257 003 | 114 713 | 44.63 | 108 994 | 42.41 | 1 798 | 1.65 | 107 196 | 98.35 |
| SZABOLCS-SZATMÁR-BEREG | 457 986 | 204 160 | 44.58 | 194 932 | 42.56 | 3 319 | 1.7 | 191 613 | 98.3 |
| TOLNA | 187 123 | 85 465 | 45.67 | 81 479 | 43.54 | 1 246 | 1.53 | 80 233 | 98.47 |
| VAS | 208 043 | 108 205 | 52.01 | 102 661 | 49.35 | 1 653 | 1.61 | 101 008 | 98.39 |
| VESZPRÉM | 290 477 | 138 153 | 47.56 | 130 630 | 44.97 | 1 969 | 1.51 | 128 661 | 98.49 |
| ZALA | 229 695 | 111 670 | 48.62 | 105 948 | 46.13 | 1 657 | 1.56 | 104 291 | 98.44 |
* In % of all of those eligible to vote
** In % of all of the valid vote
| Number of those eligible to vote |
Turned out to vote | Valid votes | Yes | No | |||||
|---|---|---|---|---|---|---|---|---|---|
| number | percentage (%) |
number | percentage (%)* |
number | percentage (%)** |
number | percentage (%)** |
||
| Total votes cast in Hungary | 7 986 767 | 3 506 618 | 43.91 | 3 280 459 | 41.07 | 54 924 | 1.67 | 3 225 535 | 98.33 |
| Votes cast in foreign representations | 11 231 | 9 360 | 83.34 | 7 984 | 71.09 | 239 | 2.99 | 7 745 | 97.01 |
| Persons voting by post | 274 627 | 130 356 | 47.47 | 129 944 | 47.32 | 1 000 | 0.77 | 128 944 | 99.23 |
| Referendum total | 8 272 625 | 3 646 334 | 44.08 | 3 418 387 | 41.32 | 56 163 | 1.64 | 3 362 224 | 98.36 |